

The secondary care acute sector comprises acute, specialist acute and combined trusts delivering urgent and emergency care, planned care and specialised care for different conditions such as rare cancers, genetic disorders or complex medical or surgical conditions. For this summary, we explore trends across A&E services, diagnostics, the elective care waiting list and cancer services. We also look at data relating to current levels of NHS capacity such as general and acute beds and metrics of patient flow.
Demand and activity
It has been the busiest winter (December to February) on record for A&E departments. In planned care, trusts delivered record January numbers of diagnostic tests and cancer checks.
A&E
A&E attendances in February (2.08 million) were lower than last month and last year but contributed to the busiest winter period on record (6.65 million across December 2024 to February 2025 combined).
There were 496,100 emergency admissions in February, close to 10% fewer than January. The number is nearly 6% lower than a year ago and nearly 3% lower than five years ago in February 2020. This winter, emergency admissions were 2% lower than last winter, showing that increased demand isn't translating into an associated increase in emergency admissions.
Figure 1
Monthly A&E attendances

Consultant-led referral to treatment (RTT)
- Over 1.59m admitted and non-admitted treatments were delivered in January, over 255,000 (20%) more than in December 2024 but broadly in line with January 2024. There were 1.82m new RTT pathways in January, a 17% increase from December 2024 but also broadly in line with last January's figure.
Diagnostics
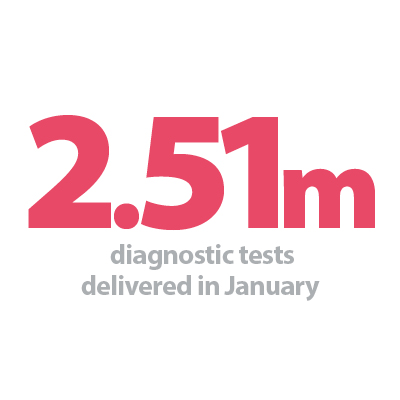
- January 2025 saw the second highest number of diagnostic tests on record: 2.51m. This is 12% more tests than last month, 7.4% more than last year and over 20% higher than pre-pandemic levels.
- The number of MRI, CT and colonoscopy scans increased compared to last month (by 8.4%, 6.6% and 13.9% respectively) and compared to last year (up by 10.6%, 6.7%, 3.8% respectively).
Cancer
- In January 2025, the highest January activity on record was delivered across all pathways. In comparison to December: the 28-day faster diagnosis pathway increased by 9.1% to 266,290; the 31-day pathway increased by 15.6% to 58,620; the 62-day pathway increased by 10.3% to 28,220.
Figure 2
Total monthly diagnostic tests

Waiting times
Waiting times across planned and urgent and emergency care remain a challenge but progress was seen in some areas this month. In emergency care, there were improvements in the proportion of patients seen within four hours in A&E and the number of patients waiting over 12 hours for admission in February. The waiting list fell back slightly for the fifth consecutive month, but the proportion of pathways seen within 18 weeks remains unchanged. The diagnostic waiting list grew this month, but there were improvements in the proportion seen within six weeks.
A&E
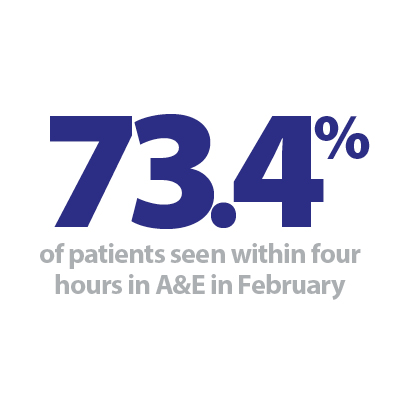
- Performance against the A&E four-hour waiting time target increased to 73.4% in February from 73% last month. A move in the right direction but missing the upcoming target of 78% by March 2025.
- The performance across type 1 A&E only (excluding other types of A&E delivered by these trusts) also improved, by 0.7 percentage points, to 58.4% in February. But this means that around two in five attendances to major A&E departments waited longer than four hours.
- Of the 121 reporting trusts with a type 1 A&E department, 26 trusts met or exceeded the current 76% recovery milestone and 18 are currently meeting or exceeding the 78% March 2025 target.
- The number of patients waiting 12 hours from the decision to admit to admission slipped back from January's record (61,530) to 47,620 in February (see figure 3). But this winter period (December – February combined) had the highest figure on record at 163,360. This is 15% higher than last winter and 24 times higher than winter 2019/20, when 6,810 people waited more than 12 hours to be admitted.
- There were 1.27 million attendances at type 1 and 2 emergency departments in February, with 141,490 patients waiting more than 12 hours from arrival at A&E (11.3% of attendances). This is 31,020 fewer than January and 10,960 fewer than February 2023. This measure over winter (December – February) was very slightly lower than last winter (-0.4%).
Figure 3
Monthly number of patients spending >12 hours from decision to admit to admission

Consultant-led referral to treatment (RTT)
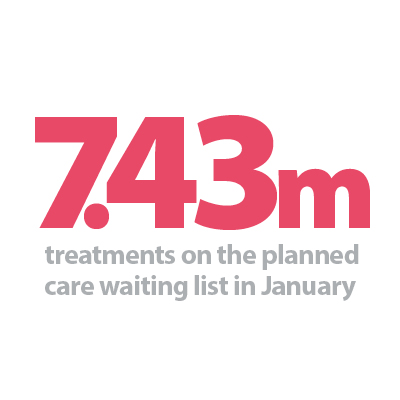
- The waiting list reduced slightly for the fifth month running to 7.43m in January (35,090 fewer treatments than last month).
- The size of the waiting list is nearly 2% smaller than it was a year ago but is 63% greater than five years ago in January 2020, before the pandemic.
- Trusts reduced waits >52 weeks (-1,510), 65 weeks (-593), >78 weeks (-54) and >104 weeks (-16). Waits over 18 weeks fell by 8,370 to 3.06m treatments waiting more than 18 weeks, equivalent to 58.9% of all waits.
- 198,870 treatments are waiting for more than a year (52 weeks) and 139 treatments waiting for longer than two years (104 weeks).
- In January, 84.2% of patients on the waiting list were unique patients; an estimated 6.25 million people.
- 10 out of 153 reporting trusts had over 100,000 treatments waiting, accounting for 1.3m treatments on the waiting list.
Diagnostics
- After decreasing in size in December, the diagnostic waiting list increased by 59,620 in January to 1.62m. Compared to last year, the waiting list is up slightly by 2.7% and up by 55.2% compared to January 2020, before the pandemic.
- 2.4% of patients waited six weeks or more for a test in January, improving very slightly from 22.8% last month but falling short of the 5% target.
- Out of 155 reporting trusts, 26 met or exceeded the target to see 95% of patients in 6 weeks in January, in line with last month.
Cancer
- Despite record January activity levels across all three pathways, performance slipped back against all three standards in January.
- After meeting the 28-FDS pathway standard (75%) for the last two months, performance fell short in January (73.4%) and moved further away from the upcoming March 2025 target of 77%.
- 31-day combined: Performance fell from 91.5% to 88.8% this month, falling short of the 96% standard.
- 62-day combined: 67.3% of referrals met the standard this month, down from 71.3% last month. Trusts moved further away from the target to improve performance to 70% by March 2025 and 75% by 2026.
Figure 4
Percentage of patients told cancer diagnosis or cancer definitively excluded within 28 days of an urgent GP referral for suspected cancer

Capacity
Over winter, maximising capacity is a key priority for hospital staff, particularly with the challenges of seasonal illnesses. However, delayed discharges remain a daily challenge for hospital staff across England:
- On average in February, there were 23,480 patients who no longer met the criteria to reside and, of these, 58.4% remained in hospital each day. This is slightly lower than the 23-month high seen in January (58.5%).
More information on the latest bed occupancy figures can be found in the winter section.